
Expected Assists Xa in Football Explained: Is It Worth It?
This post contains affiliate links. As an Amazon Associate, we earn from qualifying purchases.
*Expected assists (xA) is an advanced metric that credits a passer for creating a scoring chance, often using the expected goals (xG) value of the resulting shot.* It isolates creative performance from a teammate’s finishing, giving a value between zero and one that adds up over time. Unlike a simple assist count, xA reveals which players consistently create the most dangerous chances.
This number solves a familiar problem. You see a perfect pass sliced through the defense, only for the striker to blast over. The passer gets nothing in the stats column, while a player who makes a simple sideways pass before a wonder strike gets a full assist. XA corrects that by crediting the quality of the chance created, not the outcome. A key concept here is expected assists xa in football explained. The rest of this guide walks through what goes into that number, how different providers calculate it, and what to watch for so you can use it properly.
Key Takeaways
- xA credits a passer with the xG value of the shot their pass created, valuing the chance quality over the finish.
- A single xA value sits between 0 and 1; a season total is the sum of all these values, showing underlying creative output.
- Major data providers use different models (some require a shot, others grade all passes), causing variation in public numbers.
- Judge a player’s xA over a full season or more; it needs about 100 key passes in a season to stabilize and reveal true creative level.
- Compare a player’s actual assists to their xA to gauge finishing luck, a big gap suggests over- or under-performance by teammates.
What Does xA Actually Measure?
Think of the last time you saw a midfielder split a defense with a through ball. The recipient is clean through, one-on-one. That pass deserved credit, regardless of whether the shot went in. Expected assists exists to give that credit.
At its core, xA is the pass-side counterpart to expected goals (xG). Sources differ: some (like Opta Analyst) define it as the likelihood a pass will become an assist, while others (like Wyscout) define it as the xG value of the shot the pass led to. The Opta Analyst definition states it measures “the likelihood that a completed pass will become a goal assist,” considering factors like pass type, end-point, and length.
Technical Snippet: The xA model is based on the finishing location of the pass, what type of pass it was and a variety of other factors. This model is not reliant on whether a shot was taken from this pass, so credits all passes, regardless of whether they result in a shot. (Source: Stats In Sport, quoting Opta)
Implementations vary: some providers (like Wyscout) use a shot-based definition, while others (like Opta’s quoted model) use a pass-based definition. A provider like Wyscout defines xA as “the value of expected goals (xG) of the shot that this pass led to.” So, if your pass sets up a shot with an xG of 0.62, you get 0.62 xA. That number gets added to your match or season total. It’s a direct transfer of value from the shot to the pass that created it.
This focus on the shot’s xG, as the expected assists xa in football explained, is why a tap-in pass is worth so much more than a hopeful cross. It’s not about the difficulty of the pass itself, but the danger of the situation it produces.
How xA is Calculated: The Model’s Moving Parts
The calculation isn’t a single formula. It’s a model trained on historical data, millions of passes and their outcomes. The model looks at specific variables around the pass to spit out that probability between zero and one.
According to the Opta Analyst, the model considers the type of pass (through ball, cross, cut-back), the length and angle of the pass, and the finishing location where the ball is received. Other providers add more layers.
| Model Input | How It Affects xA Value | Real-World Example |
|---|---|---|
| Pass End Location | The closer to goal, the higher the xA. | A sideways pass in the 6-yard box has a much higher xA than the same pass at the halfway line. |
| Pass Type | Through balls rate higher than crosses. | A through ball splitting defenders creates a higher-xG shot than a lofted cross into a crowded box. |
| Game State | Open play vs. Set piece changes the base probability. | A corner kick is treated differently from an open-play cross, even to the same spot. |
| Receiver Context | Defender pressure and body position matter. | A pass to a striker facing goal is worth more than one to a player with their back to it. |
Advanced stats explainers, including the expected assists xa in football explained, reinforce that these factors are weighed to produce a single probability. The model is essentially asking: “Given all these conditions, what is the chance this pass becomes an assist?”
Where this gets tricky is the shot requirement. The Wyscout glossary is clear: xA is the xG of the shot the pass led to. No shot, no xA. But as the Opta quote above shows, some models assign a value to every pass, shot or not. This is a fundamental disagreement in how to define the metric, and it’s why numbers from different sources won’t always match.
xA vs. Actual Assists: Spotting Luck and Finishing
Your assist tally depends on your teammates. Your xA does not. That difference is the entire point of the metric.
A concrete case from the 2023/24 Premier League season illustrates this. Bruno Fernandes created chances worth 16.7 xA, but only registered 8 actual assists. His Manchester United teammates underperformed against the quality of chances he created. On the flip side, a player with clinical finishers around them might have more assists than xA.
This gap, assists minus xA, is a signal. A positive number suggests good fortune or excellent finishers. A negative number hints at poor finishing or bad luck.
Where this goes sideways: Judging a creator by assist count alone in a small sample. A player can have zero assists from five great chances in three games, then get three assists from mediocre passes in the next match. The xA totals tell the stable story.
Here’s a simple comparison to show what each stat captures:
| Aspect | Actual Assists | Expected Assists (xA) |
|---|---|---|
| Depends on Teammate’s Finish? | Yes. Only counts if a goal is scored. | No. Credits the pass even if the shot is missed. |
| Values Chance Quality? | No. A simple pass and a perfect through ball both count as 1. | Yes. A tap-in pass might be 0.8 xA; a hopeful cross might be 0.05. |
| Stability Over Time | Noisy. Heavily influenced by random finishing variance. | Stable. Reflects underlying creative performance more reliably. |
| Best Used For | Recording events on the scoresheet. | Evaluating creative contribution and predicting future assist output. |
This is why scouts and analysts lean on xA. When The Football Analyst notes that a pass creating a 0.35 xG chance gives 0.35 xA, they’re building a profile of a player’s creative output that ignores who’s on the receiving end.
The Shot-Based vs. Pass-Based Disagreement

Not all xA is created equal. Depending on where you get your data, the very definition changes. This is the biggest trap for new users.
The shot-based definition is most common in public discourse. Wyscout, The Football Analyst, and datafield.dev all describe xA as the xG of the resulting shot. This means a pass that doesn’t lead to a shot earns zero xA. It’s a clean, direct chain: pass → shot → xG value assigned to passer.
The pass-based definition, as quoted by Stats In Sport from Opta, says the model “credits all passes, regardless of whether they result in a shot.” Here, every pass gets a value based on its likelihood of becoming an assist, shot or no shot.
Why does this matter? For deep-lying playmakers, it changes everything. A regista pinging a ball to the feet of a winger, who then dribbles and shoots, gets no credit under a strict shot-based model. The pass-based model would assign that initial pass some xA value based on the position it created.
Common mistake: Assuming the xA number from different public sources all mean the same thing. They often don’t. Some providers use a shot-based metric, while others use a pass-based model.
This provider split is a crucial piece of context. Before you cite a player’s xA, know whose model produced it. It’s the difference between measuring the assist potential of every action and measuring only the assist potential of actions that immediately lead to shots.
Relationship Between xA and xG
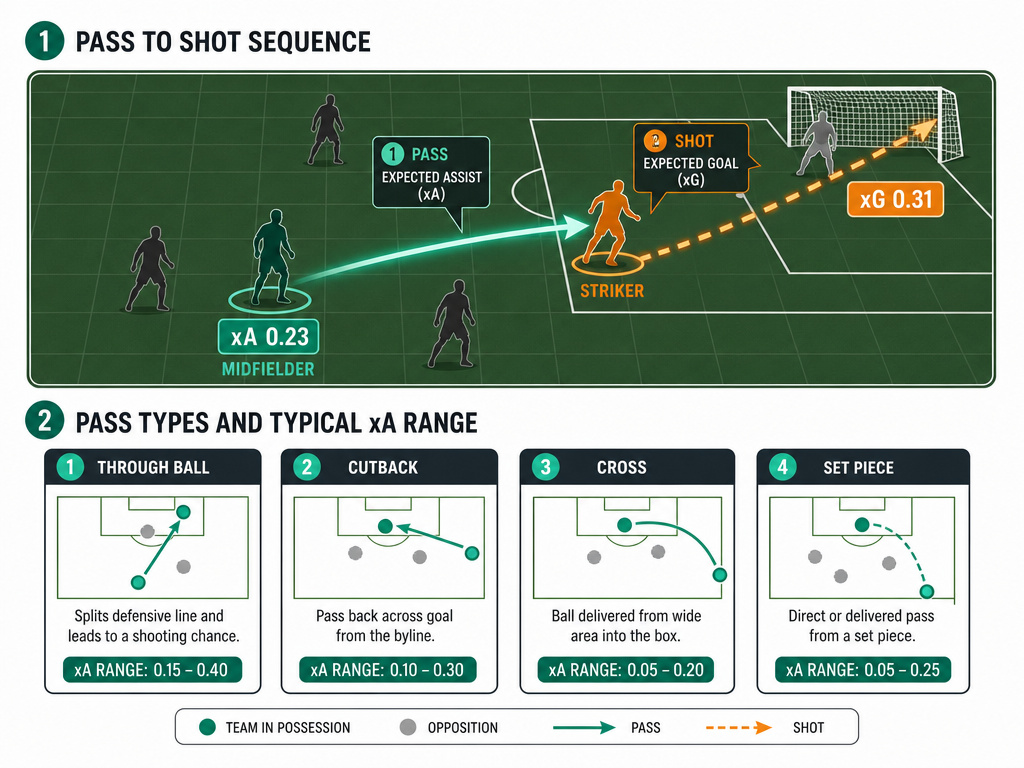
You can’t have one without the other. XA is built directly on top of the xG framework.
Think of it as a transfer of credit. When a pass leads to a shot, the xG value belongs to the shooter, and the xA value (equal to that xG) belongs to the passer. As datafield.dev puts it: “The sum of all xA equals sum of xG from assisted shots.” The sum of all xA equals the sum of xG from assisted shots.
This relationship creates a useful check. If a team has a high xG but a low xA, it means they’re creating chances through individual brilliance or unassisted shots (like rebounds, solo runs). High xA relative to xG suggests a team reliant on crafted, assisted chances.
How Different Pass Types Feed xG
Not all passes contribute equally. The model knows this.
- Through Balls: These are the gold standard. They typically put the receiver in behind the defense, facing goal, leading to high-xG shots. The model awards them high xA values.
- Cutbacks: Passes pulled back from the byline into the penalty area. They generate high-quality chances because the shooter is often central and close to goal.
- Crosses: Statistically inefficient. A crossed pass, even into the 6-yard box, has a lower probability of resulting in a goal than a through ball to the same spot. The xA model reflects this, assigning them lower values on average.
- Set Pieces: Corners and direct free-kicks are their own category. A provider like Wyscout includes them, but analysts often recommend checking open-play xA separately to avoid skew from set-piece specialists.
Understanding this helps you read the game. A player with high xA from open play is consistently breaking lines. A player with high xA mainly from set pieces is a dead-ball specialist, both valuable, but in different ways.
How to Read and Use xA

So you see a player has 9.5 xA. What does that mean? How do you use it?
First, context is everything. Raw xA totals are almost meaningless without a minutes-played qualifier. Always look at xA per 90 minutes (xA/90). An attacking midfielder with 0.35 xA/90 is creating elite-level chances. For a winger, 0.25 xA/90 is very strong. A central defender with 0.02 xA/90 is about normal.
Second, mind the sample size. This is where most casual analysis falls over. Datafield.dev provides the key thresholds: xA needs about 100 key passes in a season to stabilize. For a player producing only 30–50 key passes, you need 18–24 months of data to be confident in their true level.
Worth knowing before you start: Declaring a player “unlucky” because their assists are below their xA after ten games is a guess. Wait. The signal needs time to rise above the noise of random finishing.
A Practical Guide to Interpretation
- Find the Data: Use public sites like FBref (which pulls StatsBomb data) or Understat. Check which metric they label “xA” and read their glossary.
- Calculate Per-90 Rates: Divide the player’s total xA by their minutes played, then multiply by 90. This levels the playing field between starters and subs.
- Compare to Assists: Look at the Assists – xA difference. A large positive difference (+3 or more) flags potential overperformance. A large negative difference suggests poor finishing around the player.
- Check the Pass Map: Don’t just trust the number. If a player’s xA is high, look at their pass map. Are they creating chances from open play or set pieces? Are they threading through balls or recycling possession?
- Use it with Other Metrics: xA is a powerful piece of the puzzle, but it’s not the whole picture. Pair it with progressive passes, shot-creating actions, and key passes to get a full view of a player’s creative role. Our guide on interpreting football data covers this synthesis in detail.
Limitations and Common Misconceptions
XA is a tool, not a truth. It has blind spots.
It misses the pre-assist. The pass before the assist, the one that breaks the initial line of pressure, gets no credit in a standard xA model. For deep playmakers, this is a huge gap. Analysts use metrics like xGChain or xGBuildup to capture these contributions.
It’s model-dependent. As we’ve seen, one provider’s xA is another provider’s xAG. Providers don’t fully agree on the mechanics of xA. The values are not guaranteed to match pass-for-pass across Opta, StatsBomb, and Wyscout.
It can be gamed by volume. A player who takes every set-piece and whips in 200 low-probability crosses might accumulate an xA total, but it doesn’t mean they’re a creatively efficient player. This is why checking open-play xA is a recommended practice.
It doesn’t account for the passer’s difficulty. The model rates the situation the pass creates, not the skill required to make the pass. A 40-yard raking through ball and a simple 5-yard square pass to the same spot would receive the same xA. The eye test still matters.
The biggest misconception is treating xA as a perfect grade for a passer. It’s not. It’s a probability model of chance creation, built on historical data. It’s brilliant for identifying patterns and stripping out finishing variance, but it can’t capture everything that makes a pass creative. For that, you still need to watch the game. The rise of player tracking is adding new layers to this analysis, but the core principle holds: use the numbers to inform your view, not replace it.
Frequently Asked Questions
What does xA stand for in football?
XA stands for Expected Assists. It’s an advanced metric that estimates the likelihood a given pass will become a goal assist, based on factors like pass type, location, and game state.
What’s the difference between xA and a key pass?
Key pass is a simple count: any pass that leads directly to a shot. It gives the same credit for a pass leading to a tap-in as one leading to a 30-yard blast. xA weights each of those passes by the quality (xG) of the shot it created. Two key passes can add very different amounts to a player’s xA total.
Is xA the same as xG Assisted (xAG)?
Often, yes, but it depends on the provider. Typically, xG Assisted (xAG) is explicitly the shot-based version: the sum of xG from shots a player assisted. Some providers, like FBref, list both an xAG column and a separate xA column from a pass-based model. Always check the source’s glossary.
What is a good xA per 90 minutes?
Strikers and defenders will naturally have much lower figures.
Why did Bruno Fernandes have 16.7 xA but only 8 assists?
This gap highlights the metric’s purpose. Fernandes created a high volume of high-quality chances (worth 16.7 expected assists), but his Manchester United teammates failed to finish them at an average rate, converting only 8. The 8.7 difference signals significant underperformance by the finishers he was supplying that season.
The Bottom Line
Expected assists cuts through the noise of finishing luck to show you who is really cooking in the final third. It turns the art of the through ball into a number you can track. But that number has rules.
Treat it like a slow-cooking stew, not a microwave meal. It needs a full season of data (100+ key passes) before it stabilizes and tells you a reliable story about a player’s creative level. Before that, it’s just an indicator.
Use it to spot the players whose assist totals don’t match their creative output, the unlucky creators like Fernandes, or the fortunate ones riding a hot streak from teammates. And always, always pair it with the match footage. The model can tell you a pass was valuable, but your eyes will tell you why. That combination, the cold probability of data analytics and the warm understanding of the game, is where the best analysis lives.
